
1911 England Census Exploratory Data Analysis
The year 1911 represents a pivotal moment in British history, after the industrial revolution and before the first world war. The England of today is of course massievly different from that of 1911, with huge technological, political and economic strides being made. Today, as recognised by Danny Dorling among others, there are some clear divides between the North and South of the country but have these divides always existed? My exploratory data analysis used data from the University of Cambridge’s digitised ‘Integrated Census Microdata’ (ICeM) to investigate trends in employment across the north and south of England. As women were starting to enter more into the workplace through this period in British history, there is also an investigation into where in the country and in which industries Women were finding work.
If you’re interested in reading the whole whole essay, click this link.
The ICeM dataset is absolutely huge and of course required a good deal of cleaning was needed. Filtering the data to download censuses by counties at a time, and then cleaning incorrect datatypes (e.g. codes intended to be integers provided as strings) and mixed value data (e.g. the occupation code for ‘not in employment’ could be -1, 0, 99, 999 or 999999) took some time. After this was completed, I needed to create industrial classifications for 700+ ‘occupation codes’ for the industry prevelance analysis I wanted to do and as well as taking time to do manually it brough up interesting questions like ‘Should you count foreign diplomats in local employment data?’ or ‘Are engineering apprentices part of the engineering or academic sector?’. The answer to those that I came to were ‘yes’ and ‘engineering’ if you’re interested.
Once the cleaning was done a variety of statistical tests were conducted to see where there were and weren’t statistically significant differences in employment between the North and South as well as Men and Women. This along with some useful visualisations helped me build the analysis the conclusions were based on. I’m always a fan of picking unique visualisations that can really fit a project, and for a geographic focus like this a heatmap certainly worked best. Heatmaps allow readers to easily identify patterns and can demonstrate disparities geographically really well.
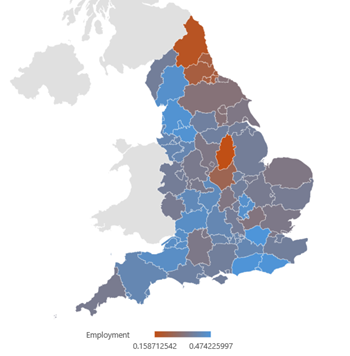
Having worked with the ICeM data, the key conclusions that I took away were that yes geographic divides have existed in England for a long time, and that on a national scale both employment levels and where women broke into the workplace had a lot to do with the industrial makeup of the area. There is a large conversation in the UK around wealth inequality right now and this can be clearly linked to Women’s employment in 1911. In areas with the largest wealth inequality and more present middle class (e.g. London, the south east in general) there are the most jobs in domestic service and hospitality (e.g. cleaners, maids), which is the single most female-dominated industry in the dataset. So while women were more able to find work in London in 1911, there clearly was (and likely still is) a long way to go to reach genuine equality in employment.
Skills:
- Data Handling
- Data Visualisation
- Communication with Data
- Statistical Analysis
- Data Processing in R
- Historical Research